
eCommerce data analytics is your guide to running your business. It gives you insight into what’s doing well, what needs work, and where you’re heading.
A plane gathers information from its different parts—engine, wings, doors, and more—and displays that information in a single dashboard with lights, meters, and other types of indicators.

A plane’s dashboard has many indicators.
To a pilot, each indicator means something. The altimeter tells them if they are at the right altitude or if they need to go higher. The fuel pressure gauge tells them if the engine is getting enough fuel or if they need to do a forced landing.
In your eCommerce business, you are the pilot. And you need meters and lights and indicators (i.e., data) to tell you whether your business is doing well, or if you need to land and refuel.
In this article, we’ll cover:
- What exactly is eCommerce data analytics
- 5 types of eCommerce metrics to add to your analytics dashboard
- 9 tools to consider investing in to gather and interpret data
What is eCommerce data analytics?
eCommerce data analytics is the process of gathering and analyzing information from different parts of your business that impact sales and performance. An eCommerce data dashboard, just like a plane dashboard, displays that data in an understandable way so that you can easily interpret the data.
More importantly, you can use that data to make informed decisions based on actual consumer behavior, instead of relying on guesses and assumptions.
5 Types of customer lifecycle metrics to build your eCommerce analytics dashboard
There are five stages in the customer journey: awareness, consideration, conversion, retention, and advocacy.
Each stage has specific eCommerce metrics that will help you turn your store into a customer-first business and generate more sales.
Here’s what metrics you should add to your reports and stay on top of for the most insights.
1) Awareness metrics
The entire customer journey starts with awareness—when your potential customers discover your brand. You need to find out how your customers hear about you so that you know which channels to invest in.
For example, if most of your customers get on your mailing list because of a recommendation, you might want to build a stronger referral program. Or if your customers follow you because of a social media ad, you might want to invest more in influencer marketing or paid ads.
Some awareness metrics to track are:
- Impressions per channel is the number of people who see and interact with your content
- Reach per channel is the number of people who already follow you—whether that’s through email or social media
- Engagement rate per channel is your number of impressions divided by your reach
- Brand search volume is the number of searches your brand gets per month
- Brand sentiment tells you how your audience feels about your brand
You can gather these metrics using analytics and social listening tools (full list below).
2) Consideration metrics
Consideration happens when people visit your online store and look through your product catalog. They’ve not necessarily bought at this point, but they should have seen the products you have on sale and are considering buying.
Consideration metrics are important because they tell you how close your website gets your audience to checking out. Or if the alternative is happening and your potential customers bounce as soon as they see your product page.
- Traffic source tells you where most of your customers are clicking from—whether that’s email, social media, your blog or some other channel
- Product page pageviews tells you how times people viewed your product without necessarily adding it to their carts
- Time spent on product pages tells you the average time it takes for your customer to go through your page (or if they’re not reading your product descriptions at all)
- Number of signups tells you how many people signed up to your mailing list based on your webpage content
- Number of cart additions tells you how times your website visitors add your products to their carts (whether or not they check out)
- Bounce rate is the number of people who leave your page within a very short amount of time divided by your product page pageviews
- Number of video or photo views tells you how many visitors were interested enough to dig deeper into what your product is like
Invest more in sources that generate the most traffic, and invest in products that get you lower bounce rates and higher pageviews and cart additions.
3) Conversion metrics
Finally, we’re at the stage where your website visitor converts or becomes a customer. Conversion metrics are important because they tell you which channels are worth the resources you put into them.
You’ll be able to analyze your budget and breakdown which investments gave you the best return of conversions.
For example, you may get 100 customers and $500 in sales from Instagram. However, you may have spent $200 on your product costs, $200 on Instagram ads, and another $100 on shipping. That would mean your cost of making a sale is $1=$1 with revenue (you aren’t earning anything).
The example above is an oversimplification. There are a lot of factors that go into determining whether or not a channel is worth it, but knowing how much a conversion costs you on different sales channels can tell you where your time and money is best spent.
Some metrics you need to have on your eCommerce analytics dashboard are:
- Average order value (AOV) which tells you how much your customers spend on your orders on average
- Customer acquisition cost (CAC) which tells you how much you’ve spent to acquire all your customers over a period of time (i.e., if your customers are all coming from organic search, then your CAC is $0)
- Cost per acquisition (CPA) which tells you how much you’re spending per customer you acquire
- Return on ad spend (ROAS) which identifies your most successful campaigns and which ones need some tweaking
- Total advertising cost of sale (TACOS) which tells you the monetary value of the sales you generate from ads
Tracking conversion metrics shouldn’t only tell you how many sales you got. It should also tell you how much those sales were worth, how much you spent to generate those sales, and which conversion campaigns need a bit more improvement.
4) Retention metrics
The customer journey doesn’t end when your customers buy a product. Ideally, all your customers become loyal customers who share your brand with their networks and buy from you repeatedly.
Tracking retention metrics will tell you which of your customers choose to stay with you and why. They are important to show you which channels are best for customer retention and brand recognition, versus which channels generate mostly one-off purchases.
Some retention metrics to pay attention to include:
- Customer retention rate gives you a bigger picture of how many customers you gained, lost, and kept over a period of time
- Customer churn rate tells you how many of your customers only buy once and then never again
- Repeat purchase rate tells you which of your products your customers purchase repeatedly
- Product return rate tells you which of your products are usually sent back and how often
- Average time between purchases tells you how often your repeat customers purchase from you
- Customer lifetime value (CLV) tells you how many times the average customer buys from you before churning
You want your customers staying with you for as long as is reasonable. Having retention metrics on your dashboard will tell you if you’re achieving that goal or if something needs to change.
5) Advocacy metrics
Lastly, you need to track advocacy metrics—or how much your customers are recommending your brand and products to their friends, family, and wider networks.
Advocacy metrics are similar to brand awareness metrics, and you can also track them through social listening and brand search monitoring.
Apart from the quantitative metrics, you can also get qualitative metrics from your existing customers by quick checkout and email surveys.
Advocacy metrics are a little more difficult to track, but you can get a good idea from the following:
- NPS score shows you how likely customers are to recommend your brand to others
- Customer referrals tell you how many customers discovered you due to a recommendation (this is something you can uncover as an optional field post-checkout)
- Referral program members shows you how many customers are willing to join your loyalty program in anticipation of advocating for your brand
- Affiliate deals tell you how effective your affiliates are at selling your brand to their audiences
Check out my list of eCommerce marketing tools to see what you can use to run NPS surveys, interview customers, and more.
9 eCommerce data analytics tools to gather insights
Manually tracking all the data you need to make informed decisions is not only difficult—it’s impossible. You can’t look into cart abandonment rate, churn rate, and all the other metrics on the list and unify them into understandable dashboards on a regular basis.
Tracking will be a nightmare and by the time you’ve built your manual dashboards, they’ll be outdated.
That’s where eCommerce data analysis tools come in. They make it so that all the data is there for the picking—all you need to do is interpret the data and improve.
1) Supermetrics: Analytics for enterprise merchants
Supermetrics is a data aggregator and warehouse for bigger companies. They have integrations with all the tools you could conceivably use to track eCommerce data—Google Sheets, Snowflake, BigQuery, Amazon S3, etc.
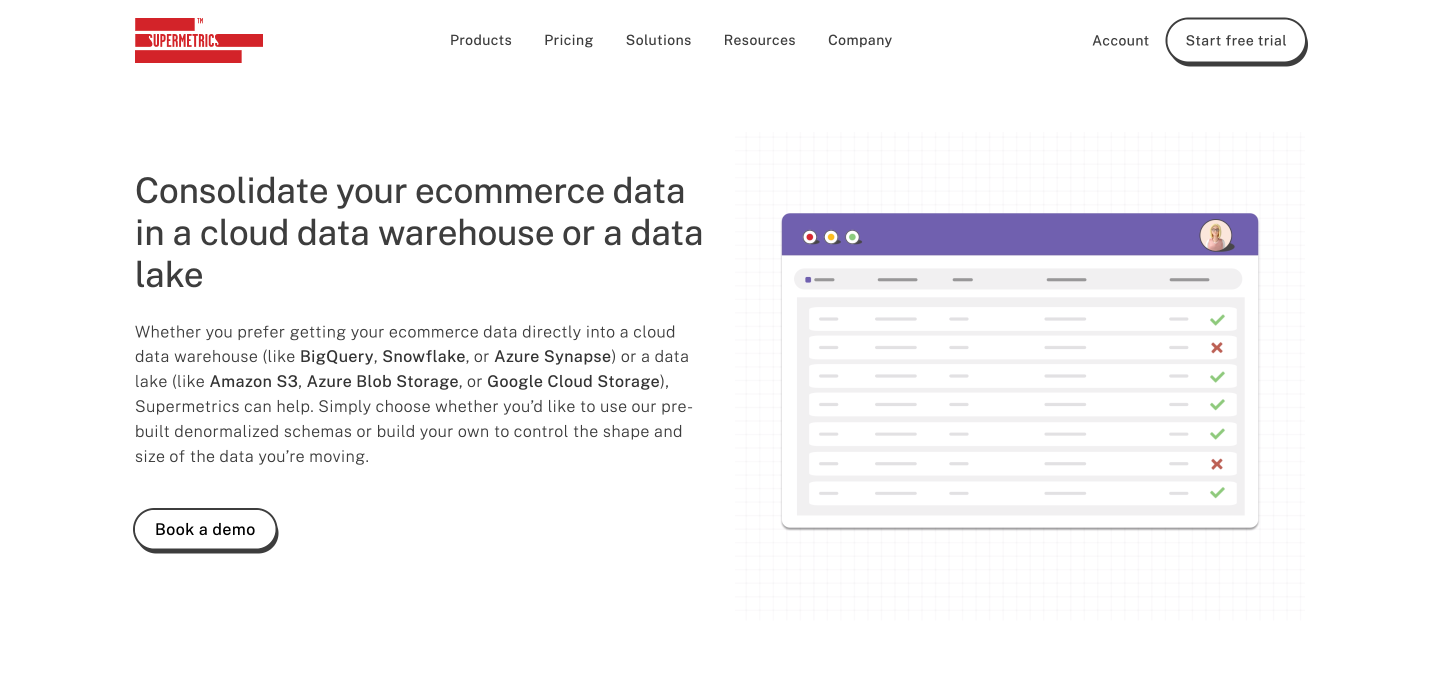
Supermetrics stands head and shoulders above its competition when it comes to dashboard customization. The tool allows shop owners to create dashboards specific to their needs, tracking and presenting the data that impacts each business the most. Though they do offer templates for users who need a little more guidance.
The tool justifies its high price point by giving you a clear and accurate bird’s eye view into your business’s day-to-day operations and your customer journey.
2) Google Analytics: Customer journey tracking
Google Analytics is a great tool for tracking your eCommerce store’s performance and mapping your customer journey. In fact, recent changes have made it easier to track and make sense of your customers’ behavior on your site.
![]()
The new Google Analytics dashboard, Google Analytics 4, tracks events instead of pageviews. That means you get data on the entire customer journey; what products they add to cart more, which ones they ignore, what they click, and more.
The downside to Google Analytics is that integrating it with your website takes some coding know-how. You also need to create tags for each event, making it a bit more inconvenient than other tools on this list.
Price: Free
3) Optimizely: Experimentation and website optimization
Optimizely is a tool built for eCommerce store owners. It makes experimentation, A/B testing, and tracking user behavior as easy as one-two-three.
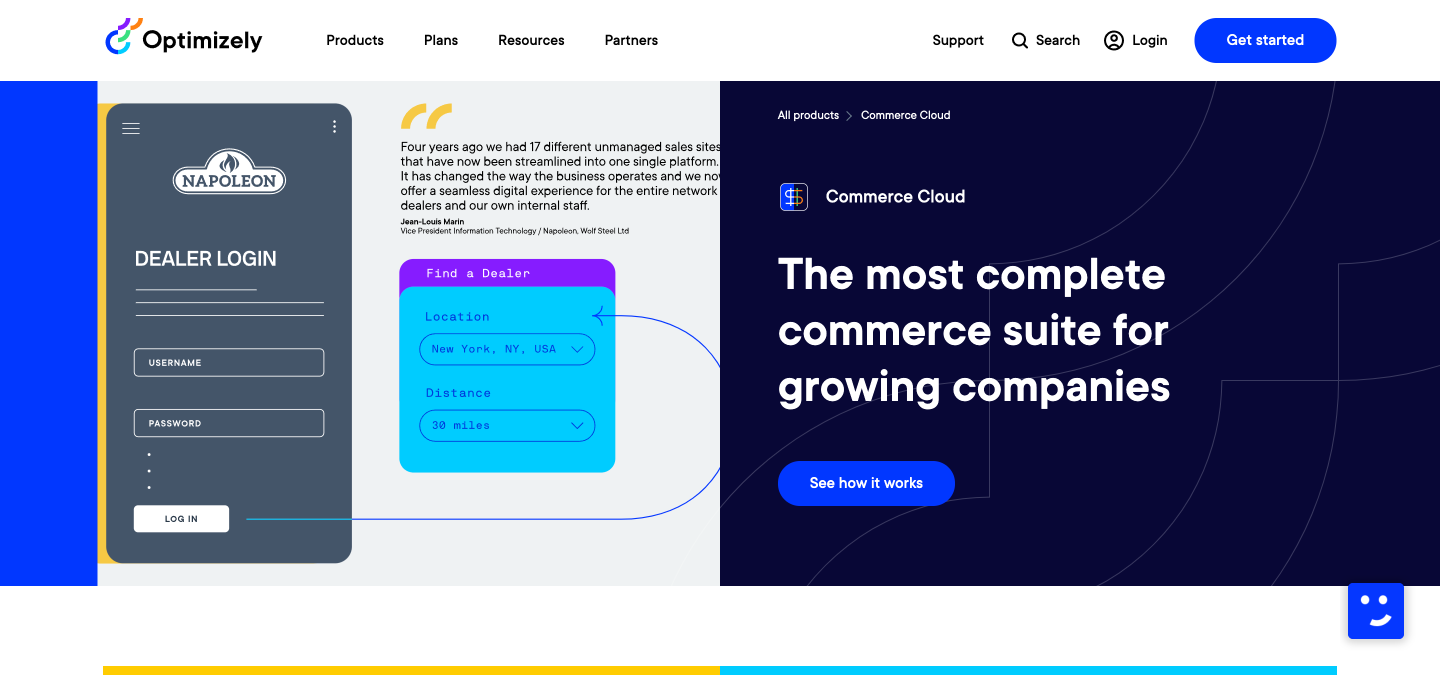
Optimizely has features like multivariate testing, behavioral targeting, multi-page experimentation, and more to help you build the perfect eCommerce store for your customers. It tracks customer behavior across your experiments and shows you which one performs better and what you can still improve.
4) Mixpanel: Multi-platform tracking and beautiful dashboards
Mixpanel is one of the biggest names in the game, and big companies like Expedia, Uber, and Rakuten Viber all use it—but unlike other tools, Mixpanel remains accessible to all companies, no matter how big or small.
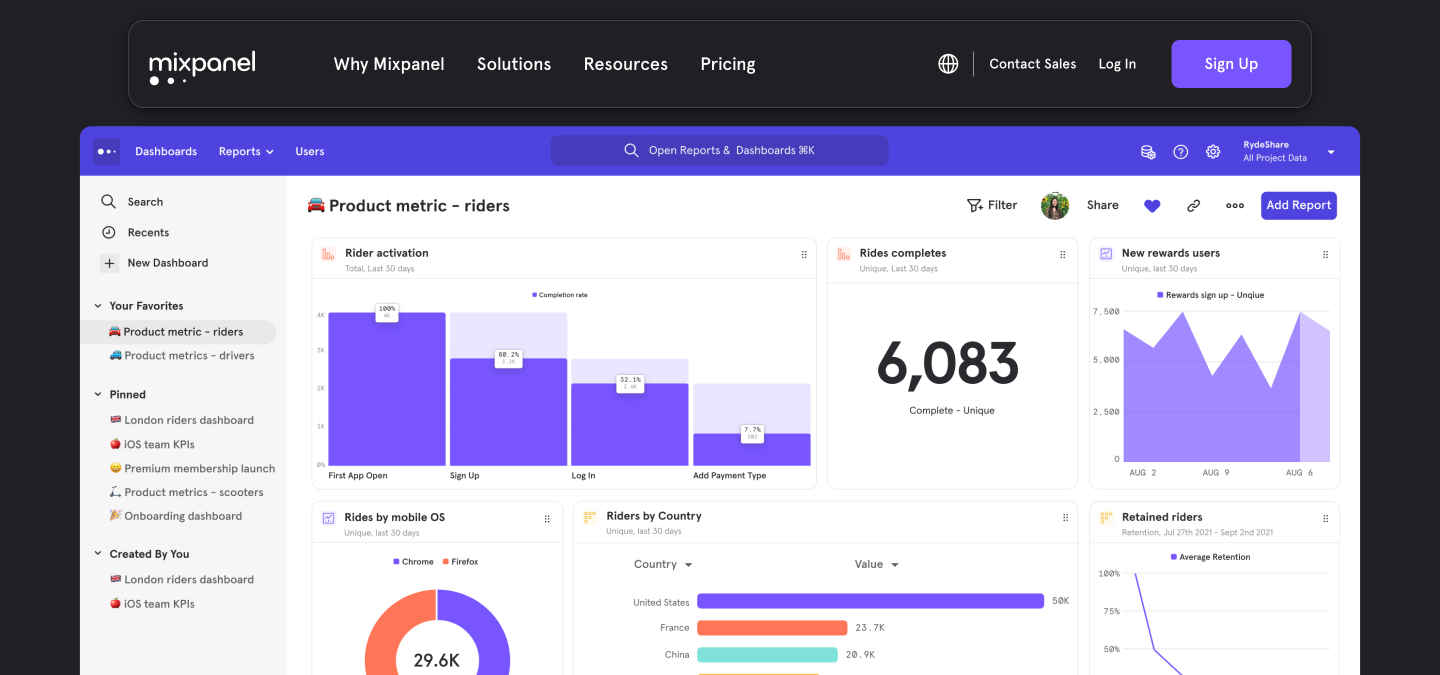
Mixpanel automatically gathers data from all the channels you use and presents it in a way that will allow you to predict what you can do to get better results. But the tool doesn’t stop there, it also allows you to validate your hypotheses with different user segments.
5) Woopra: Real-time data from real customers
Woopra is another tool that aligns itself with the customer journey. It tracks all of the metrics we previously mentioned—from awareness metrics to advocacy metrics.
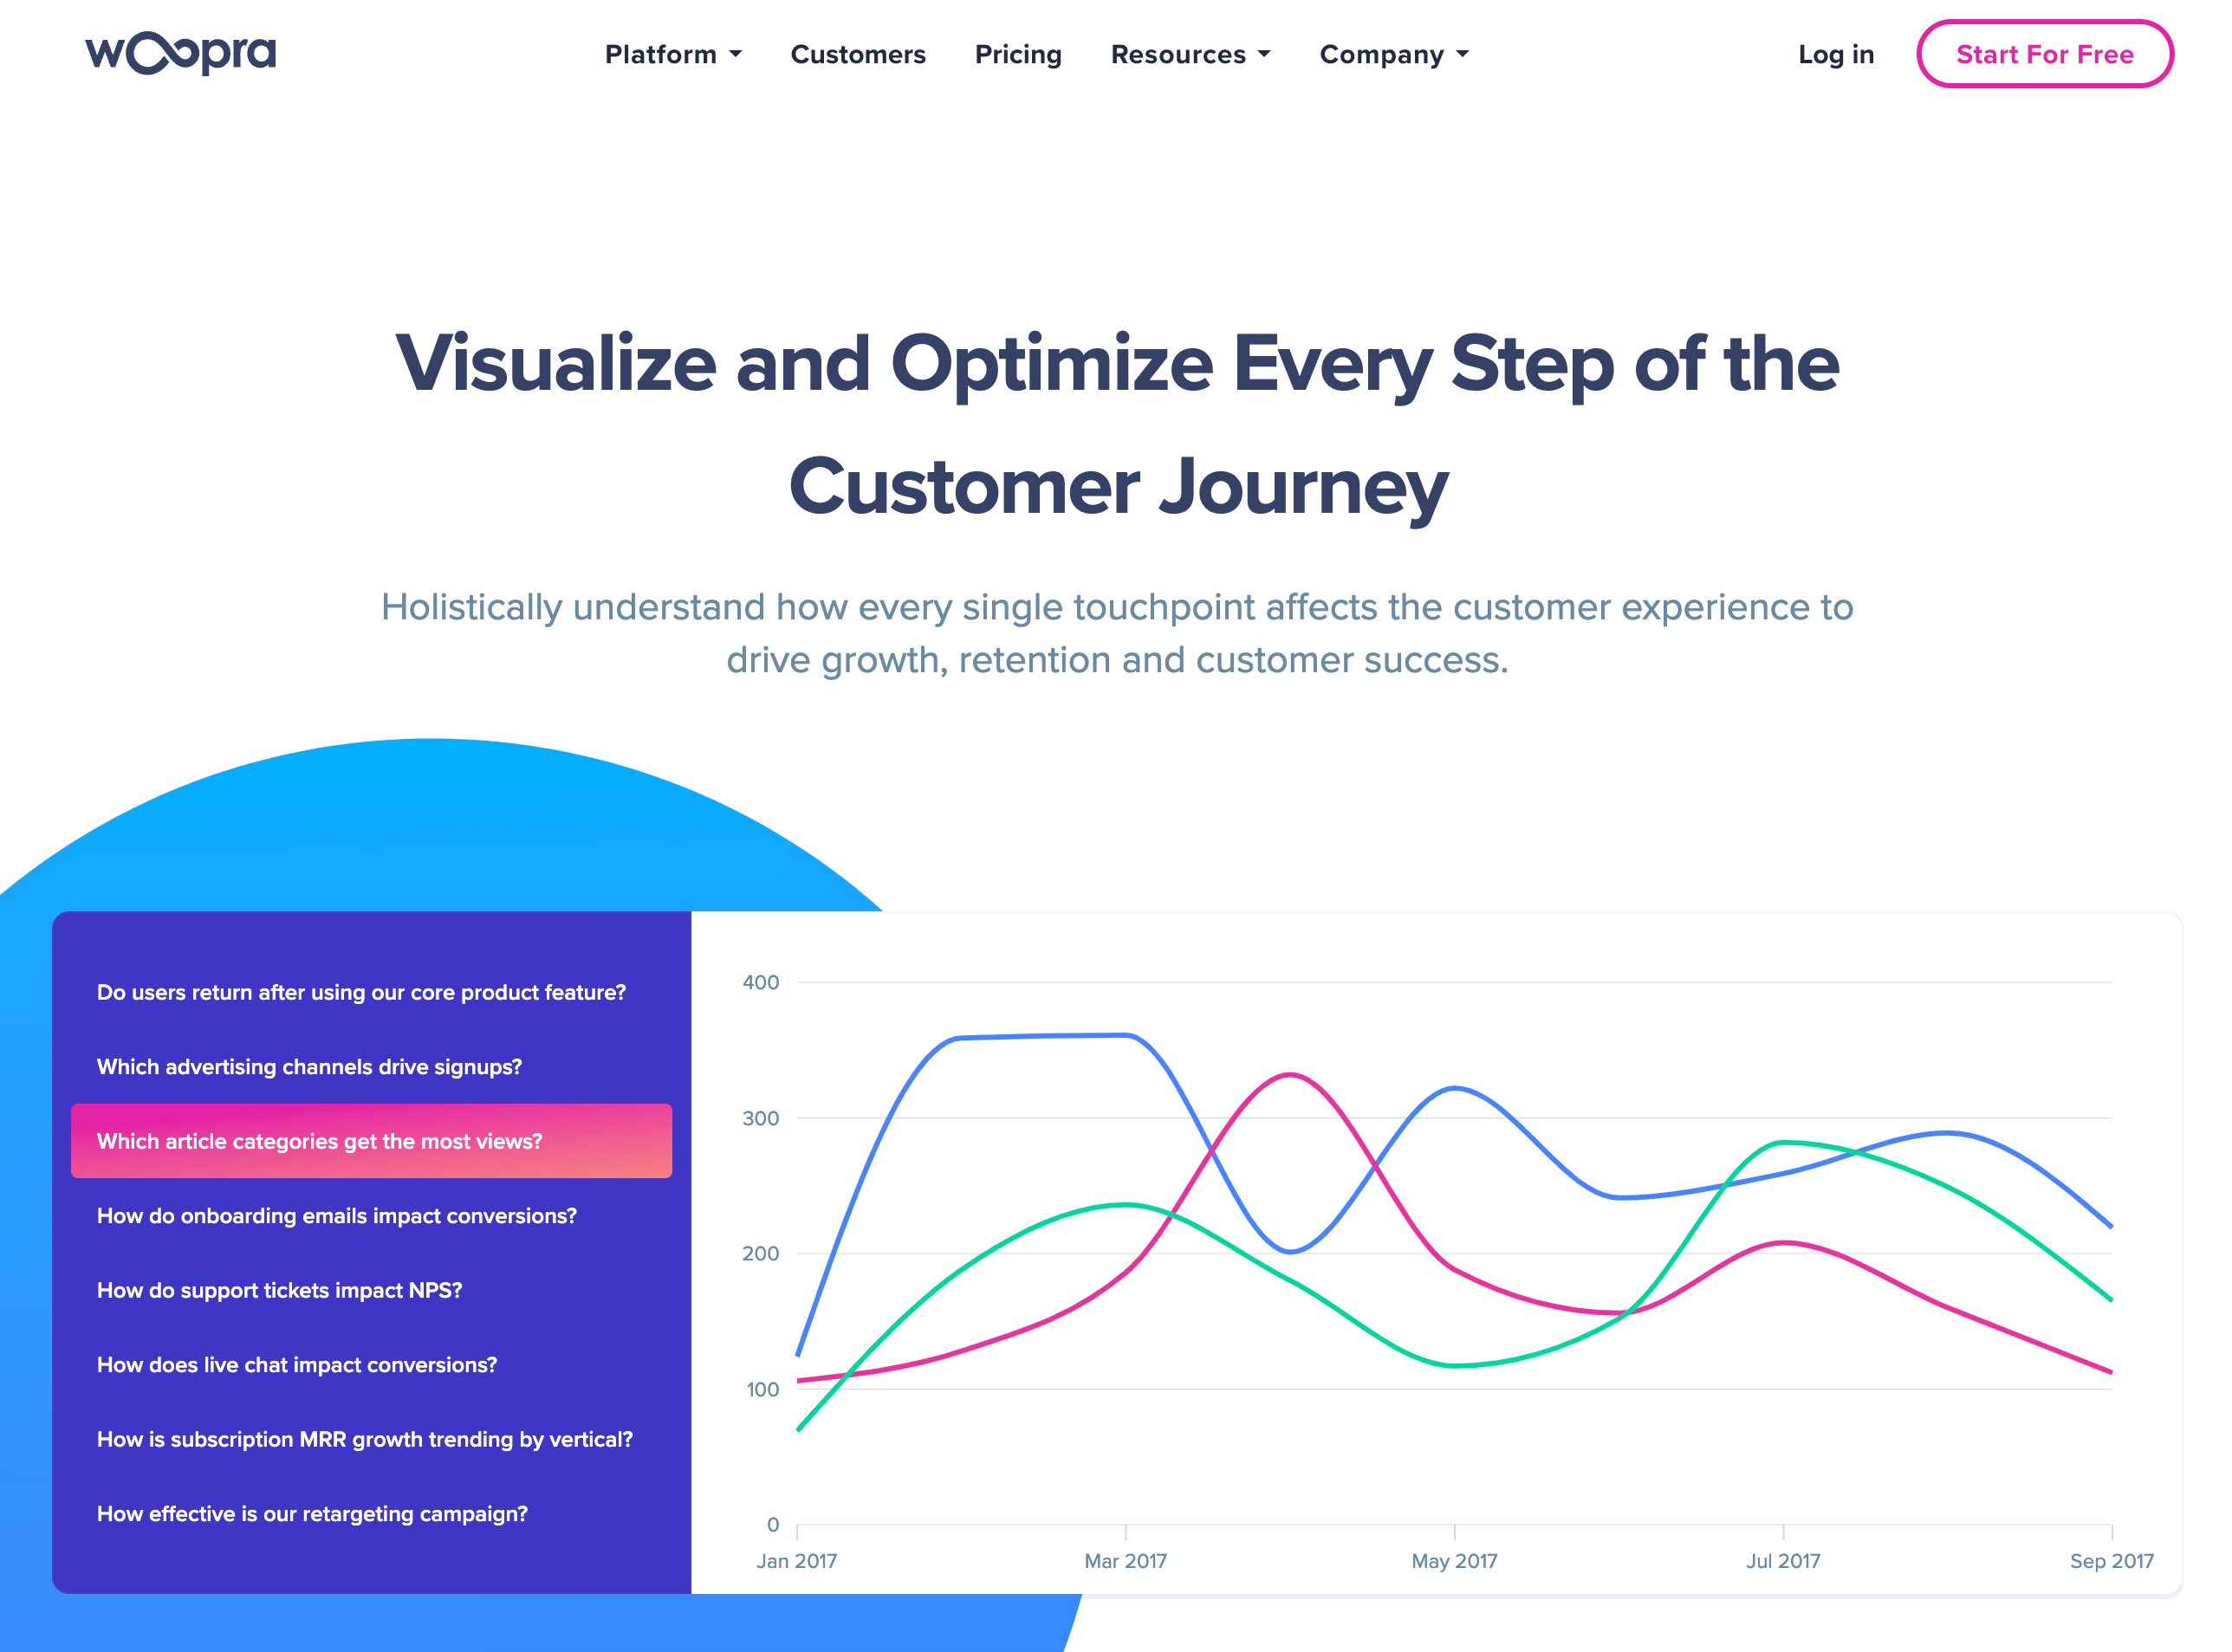
Similar to Mixpanel, Woopra uses customer segmentation to really map out the customer journey and help you understand the people who visit your site. It tracks ads, organic marketing efforts, and everything else you create events for. It also tells you where your customers are coming from and where they decide to drop off.
6) DataBox: Great user interface and understandable data
DataBox is another data visualization tool that pulls information from other tools like Google Analytics, Hubspot, MailChimp, and so on. What sets DataBox apart from the rest is their user-friendly interface and straightforward report builder.
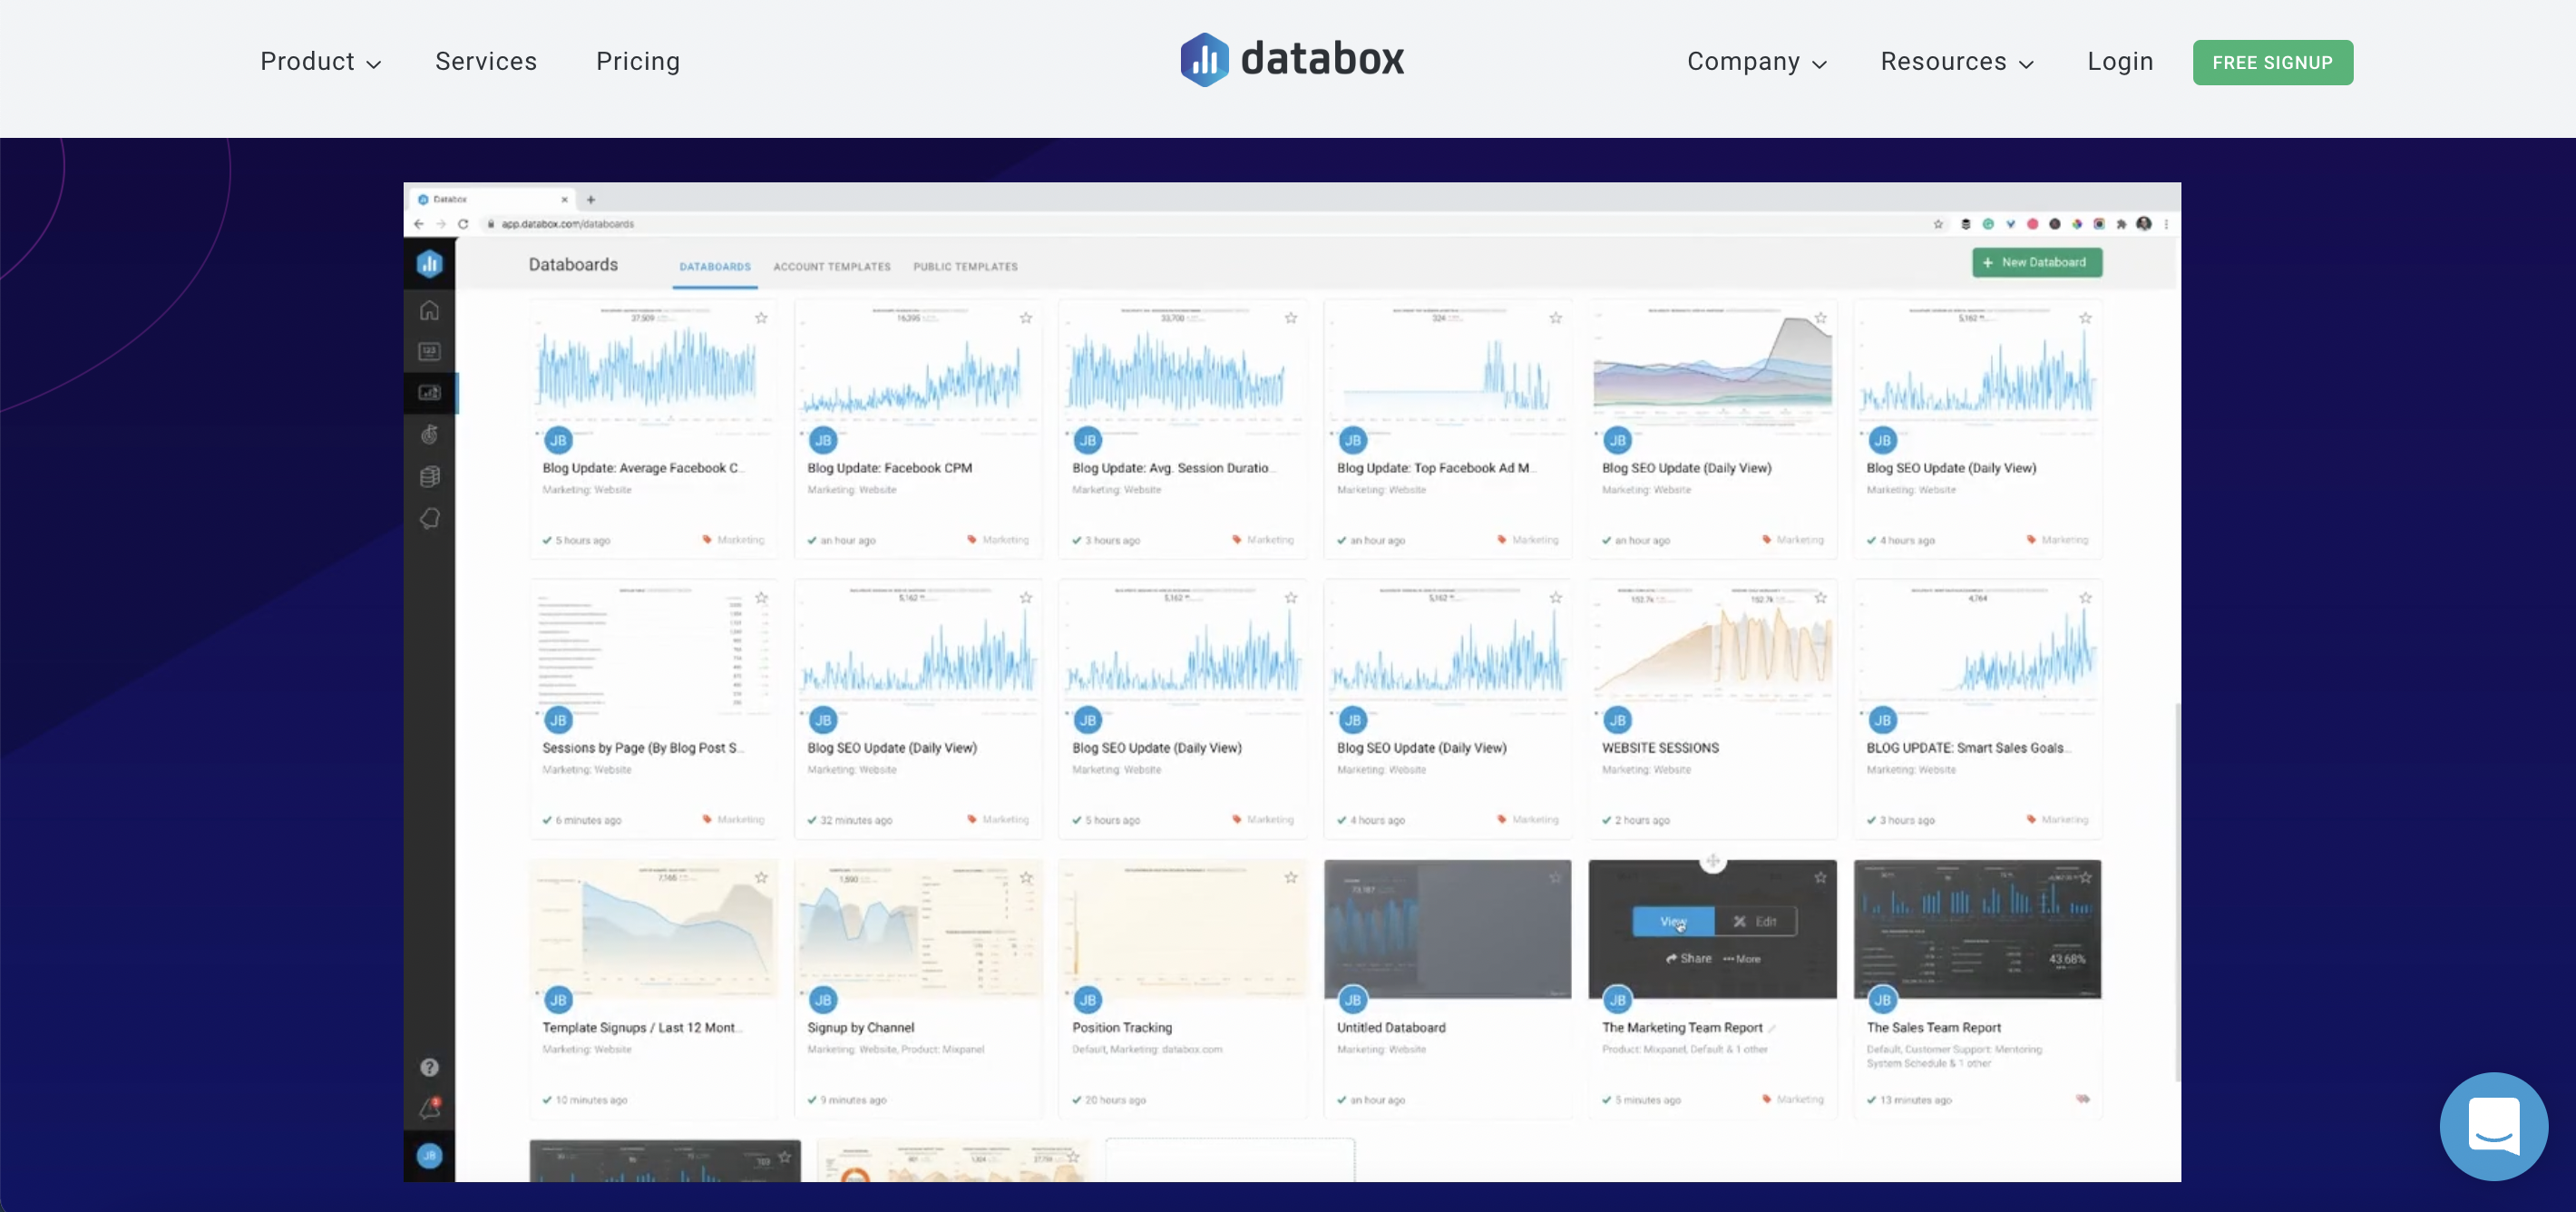
All the other tools on this list have a learning curve—some steeper than others. However, DataBox eliminates that problem by giving you your data in a single dashboard that’s both easy to use and understand.
They also have over 200 pre-built dashboards that their other customers have used to get results. With DataBox, you can easily find trends within your business and within your customer base to make decisions that’ll impact performance.
7) Kissmetrics: Product analytics and funnel optimization
Kissmetrics focuses on your product. Similar to Databox, Kissmetrics has dashboards that are easy to understand. But instead of tracking the customer journey, Kissmetrics tracks your product.
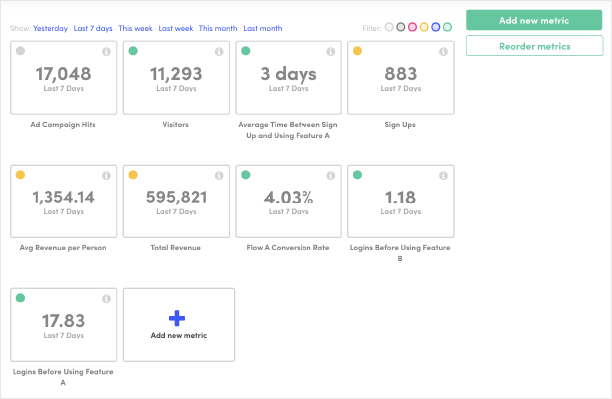
It shows you how your customers are flowing through your different funnels so that you can tweak the parts of your funnel where your customers leak out.
8) Crazy Egg: Heatmaps and customer behavior tracking
Crazy Egg uses heatmaps, session recordings, and other behavior tracking features to show you what your customers really do when they get to your site. You get to watch what they do, what they click, and what they’re looking for.
With Crazy Egg’s behavior tracking tools, you can even make educated guesses as to why your customers decide not to buy your products. Maybe your checkout button was hidden or your product video was broken.
They also support A/B testing so that you can test which web pages and landing pages encourage your customers to do more exploring.
9) DashThis: Customized dashboards based on your needs
DashThis is an automated reporting tool that can pull data in from various sources to compile the exact metrics you want to see.
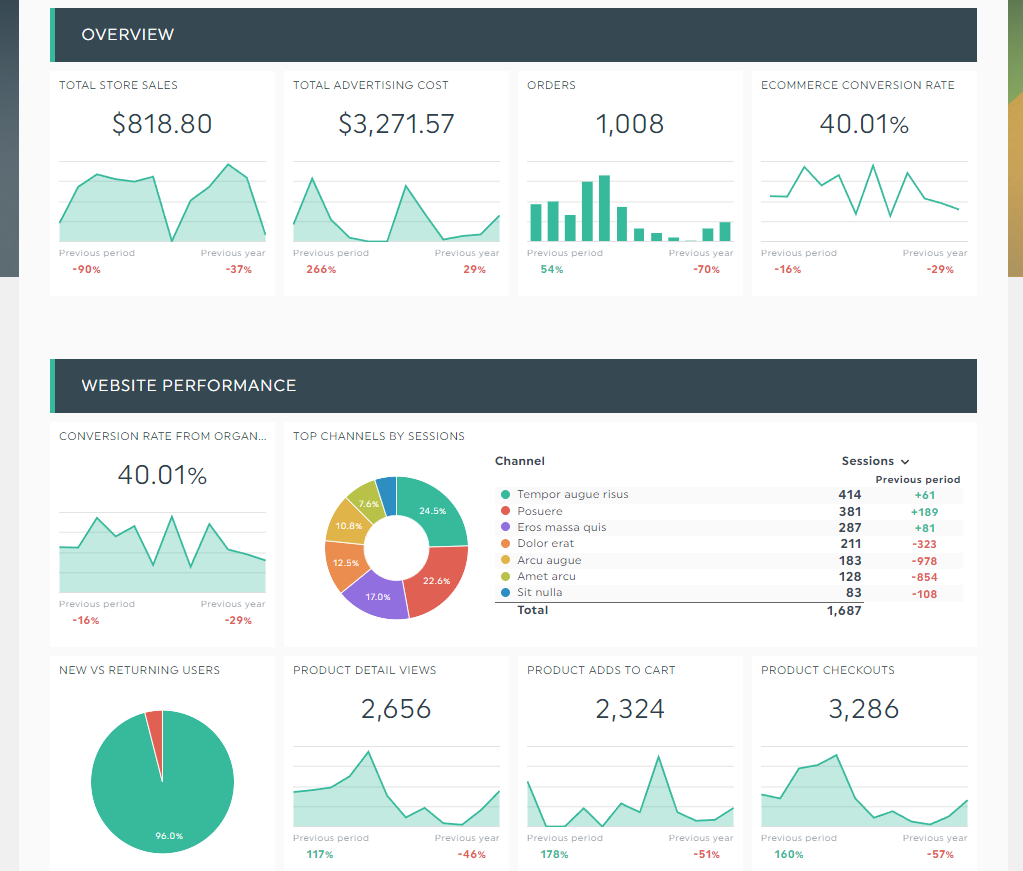
DashThis is useful for building reports that compile data from multiple different sources. Since all of their plans come with unlimited integrations, you can add as many tools that you work with to spot trends across different metrics.
For example, you can view your newsletter open rates alongside your conversion metrics, or your social media ads alongside your conversion rates.
Wrapping up — Use eCommerce data analytics to gather and analyze customer data to make better decisions
A regular passenger cannot understand a plane’s dashboard. In fact, the dashboard, with all its blinking lights and moving dials, is probably stressful and overwhelming. But a pilot knows which parts of the dashboard to pay more attention to and how to make decisions based on the information they receive.
Don’t be a passenger in your own business. Invest in tools and track the right metrics so you can stay on top of your business and make decisions that will keep you cruising.